Tampilkan postingan dengan label extent. Tampilkan semua postingan

Minggu, 15 Maret 2015

Strong Winds And Waves Batter Arctic Sea Ice

As Earth warms, the intensity of storms is rising across the globe. At least eight people died in Vanuatu, as it was hit by Cyclone Pam. "It hit Port Vila at an incredible 340 kilometres an hour", mentions a recent news report. The left part of the image below shows Cyclone Pam reaching speeds as high as 144 kilometers an hour (89.48 mph, green circle) on March 12, 2015, 1500Z, while three further cyclones feature on the Southern Hemisphere. 


At the same time, on the Northern Hemisphere, winds reached speeds as high as 101 km/h (62.76 mph, bottom green circle), 120 km/h (74.56 mph, middle green circle) and 112 km/h (69.59 mph, top green circle), as shown on the right part of above image.

The image on the right shows winds with speeds as high as 125 km/h (77.67 mph) batter the coast of Greenland on March 13, 2015 (green circle).

The image below shows strong winds moving from the North Atlantic into the Arctic Ocean on March 13, 2015. 


The video below, with cci-reanalyzer.org forecasts for March 13 - 20, 2015, shows strong winds battering the Arctic Ocean at both the Pacific and Atlantic ends.


The combination image below shows winds around Greenland (top) and winds penetrating the Arctic Ocean (bottom).


Waves as high as 41.5 ft (12.65 m) were recorded between Svalbard and Norway on March 13, 2015 (green circle on the left part of the image below), while waves as high as 23.13 ft (7.05 m) were recorded close to the edge of the sea ice on March 15, 2015 (green circle on the right part of the image below).


The updated image below shows waves higher than 10 m (33 ft) near Svalbard close to the edge of the sea ice on March 16, 2015 (green circle).


Meanwhile, it more and more looks like the 2015 sea ice extent maximum was reached on February 25, as illustrated by the image below.


The image below (added later, ed.) shows Arctic sea ice area up to March 18, 2015 (top), and Arctic sea ice extent up to March 20, 2015 (bottom). Briefly, the difference between area and extent could be compared to Swiss cheese. Area is the cheese without the holes, while extent measures the cheese in addition to the holes. For more on this, see this NSIDC FAQ.


Strong winds can cause high waves that can break up the sea ice. At the same time, strong winds can speed up currents that push sea ice out of the Arctic Ocean, while bringing warmer water into the Arctic Ocean, as illustrated by the image below.


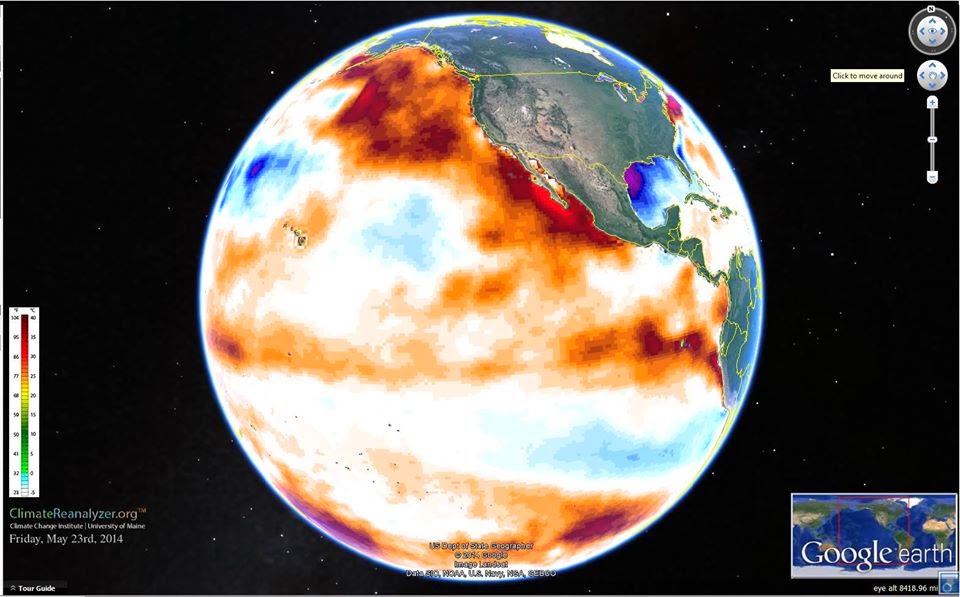
The image below shows sea surface temperatures of 20.9°C (69.62°F, green circle left) recorded off the coast of North America on March 14, 2015, an anomaly of 12.3°C or 26.54°F.

[ click on image to enlarge ]
The image below shows sea surface temperature anomalies in the Arctic Ocean on March 15, 2015.


The big danger is that warm water will trigger further releases of methane from the seafloor of the Arctic Ocean. Peak daily methane levels recorded in early 2015 averaged a very high 2370 parts per billion, as illustrated by the image below.


Natalia Shakhova et al. estimate the accumulated methane potential for the Eastern Siberian Arctic Shelf (ESAS, rectangle on image right) alone as follows:
- organic carbon in permafrost of about 500 Gt;
- about 1000 Gt in hydrate deposits; and
- about 700 Gt in free gas beneath the gas hydrate stability zone.

Hydrates can become destabilized by pressure changes that can be caused by earthquakes and resulting shockwaves and landslides, or that can be caused by wild temperature swings.

Hydrates can also become destabilized by a small temperature rise that can be caused by influx of warmer water from outside the Arctic Ocean or by warm surface water being mixed down by storms.

Waters in the ESAS are quite shallow, averaging less than 50 m depth over its 2x10ˆ6 km2 area, while methane hydrates in the ESAS can exist at depths as shallow as 20 m.

Where heat is able to penetrate the sediment along cracks, some hydrate destabilization can occur, which in turn can trigger larger destabilization, as methane escaping from a hydrate expands to 160 times its earlier volume; this explosive expansion can cause further destabilization of sediments containing methane in the form of hydrates and free gas.

The situation is dire and calls for comprehensive and effective action, as discussed at the Climate Plan blog.


Jumat, 06 Maret 2015

March 4, 2015 - Arctic Sea Ice Extent Hits Record Low

Sea surface temperature anomalies as high as 12°C (21.6°F) recorded off the east coast of North America have been described earlier, in he post 'Watch where the wind blows'. The Jet Stream reaching high speeds has also been described earlier, in the post 'Climate Changed'.


As feared, this is pushing warm water, water vapor and air from the North Atlantic into the Arctic Ocean. The three images below show forecasts for March 8, 2015, of - from top to bottom - the jet stream, surface winds and temperature anomalies.


Above image shows that the Arctic is forecast to reach a temperature anomaly of more than +4 degrees Celsius (more than +7 degrees Fahrenheit) on March 8, 2015, with temperature anomalies at the top end of the scale forecast for most of the Arctic Ocean.

On March 4, 2015, Arctic sea ice extent hit a record low for the time of the year, as illustrated by the image below.


As the March 5, 2015, Naval Research Laboratory image on the right illustrates, there is little scope for Arctic sea ice extent to grow over the next few weeks, since the only areas where it could possibly expand would be the Pacific and the North Atlantic, the very areas that are under pressure from ocean heat and high surface temperatures.

In other words, the situation looks set to deteriorate further.

Huge amounts of heat are still going into melting the sea ice. Furthermore, the sea ice is still able to reflect a lot of sunlight back into space. With continued demise of the snow and ice cover, more and more heat will be absorbed in the Arctic.

The big danger is that warm water will trigger further releases of methane from the seafloor of the Arctic Ocean. Peak daily methane levels recorded in early 2015 averaged a very high 2372 parts per billion, as illustrated by the image below.


Methane extent has been especially high over the Arctic Ocean. The images below are from the earlier post 'Temperature Rise'. The post added that, as the Gulf Stream keeps carrying ever warmer water into the Arctic Ocean, methane gets released in large quantities, as illustrated by the images below showing high methane levels over the East Siberian Arctic Shelf (red oval left) and over Baffin Bay (red oval right) with concentrations as high as 2619 ppb.

click on image to enlarge
The images below show methane levels on Jan 25 (top), and Jan 26, 2015 (bottom).


Update:
Meanwhile, Arctic sea ice extent as reported by NSIDC.org reached a new record low for the time of the year with 14.358 million square km on March 4, 2015, and another record low with 14.308 million square km on March 7, 2015.

Temperature anomaly for the Arctic on March 8, 2015 (daily average) was even higher tha forecast, at +4.26 degrees Celsius, with peaks at +4.37 degrees Celsius.


High waves were registered in the North Atlantic on March 7, 2015, moving into the Arctic Ocean and causing waves more than 4 m high close to the edge of the sea ice on March 8, 2015.


The situation is dire and calls for comprehensive and effective action, as discussed at the Climate Plan blog.


Jumat, 04 Juli 2014

The Threat of Storms Wreaking Havoc in the Arctic Ocean

Arctic sea ice extent is close to a record low for the time of the year, as the image below shows.


Furthermore, the current decline in sea ice extent is much steeper than it used to be for this time of the year, raising the specter of sea ice hitting an absolute record low later this year. Moreover, a total collapse of sea ice may occur if storms continue to develop that push the remaining ice out of the Arctic Ocean into the Atlantic Ocean.


The threat posed by storms is illustrated by the track projected to be followed by Hurricane Arthur (above NOAA image, July 4), renamed as Post-Tropical Cyclone Arthur (NOAA image below, July 5).


The path followed by Arthur is influenced by the current shape of the jet stream. As the animation below illustrates, the jet stream looks set to prevent Hurrican Arthur from moving to the east and instead make it move into the Labrador Sea to the west of Greenland and - partly due to the high mountains on Greenland - continue to wreak havoc in Baffin Bay further north.

[ Note: this animation is a 1.87 MB file that may take some time to fully load ]
As described in an earlier post, post-tropical cyclone Leslie made landfall with hurricane-force winds in Newfoundland in September 2012. The large extratropical low pressure system continued to move rapidly northeastward across eastern Newfoundland at a forward speed of near 45 kt, and merged with a much larger extratropical low over the Labrador Sea.

Recent research by NOAA-affiliated scientists suggests that - over the years - the latitude where hurricanes, typhoons, and cyclones reach their maximum intensity on the Northern Hemisphere has shifted closer to the North Pole.

Such storms can bring lots of heat and moisture into the Arctic, and they can also increase the height of waves. All this can have devastating impact on the sea ice. The many ways in which storms can increase the dangerous situation in the Arctic is described in the post Feedbacks in the Arctic.

Last month, the June heat record broke in Greenland. Very high temperatures are currently recorded all over North America, as the image below shows.


Furthermore, sea surface temperature anomalies in the Arctic are currently very high, as the image below shows.


Additionally, the sea ice is currently very thin, as shown by the Naval Research Laboratory animation below.


The above animation further shows that there now is very little sea ice left in Baffin Bay, making it easier for storms to cause very high waves that could enter the Arctic Ocean and break the sea ice north of Greenland and Canada.

Arctic sea ice volume minimum is typically reached around halfway into September. This is still months away, but the prospect of an El Niño event striking this year now is 90%, according to predictions by the European Centre for Medium-range Weather Forecasts.

All this combines into a growing threat that hydrates contained in sediments will destabilize and that huge quantities of methane will be released abruptly from the seafloor of the Arctic Ocean. The risk that this will eventuate is intolerable and calls for parallel lines of action as pictured in the image below.

Climate Plan, July 7, 2014 version, as discussed at this Climate Plan post and at the Climate Plan blog

Related

- Storm enters Arctic region
arctic-news.blogspot.com/2012/09/storm-enters-arctic-region.html

- Huge cyclone batters Arctic sea ice
arctic-news.blogspot.com/2012/08/huge-cyclone-batters-arctic-sea-ice.html

- Hurricane Sandy moving inland
http://arctic-news.blogspot.com/2012/10/hurricane-sandy-moving-inland.html

- Feedbacks in the Arctic
http://arctic-news.blogspot.com/2014/03/feedbacks-in-the-artcic.html


Selasa, 03 Juni 2014

Arctic sea ice in steep decline

Arctic sea ice area is in steep decline. The yellow line on the image below shows the sea ice area for 2014 up to June 1st, showing an almost vertical fall over the past few days.

[ click on image to enlarge ]
The Naval Research Laboratory image below compares the May 14, 2014, sea ice concentration (left) with the sea ice concentration forecast for June 10, 2014 (run on June 2, 2014, on the right).

[ click on image to enlarge ]
The NOAA image below shows sea surface temperature anomalies on June 3rd, 2014.


The NOAA image shows the huge sea surface temperature anomalies all over the Northern Hemisphere on June 3rd, 2014. Large areas with sea surface temperature anomalies up to 8 degrees Celsius and higher show up in and around the Arctic Ocean

[ click on image to enlarge ]
The image below shows sea surface temperature anomalies up to 1.5 degrees Celsius over the May-June 2014 period, with global average anomalies that hover just above 1 degree Celsius.


Above sea surface anomalies are very high, much higher than historic annual temperature anomalies over land and oceans, as shown on the image below for comparison.


In conclusion, the situation spells bad news for the sea ice, also given the prospect of an El Niño event projected to occur later this year. As discussed in earlier posts, the sea ice is already very thin, and as this image shows, ocean heat is melting the sea ice from beneath, while the sun is warming up the ice from above. At this time of year, insolation in the Arctic is at its highest, as Earth reaches its maximum axial tilt toward the sun of 23° 26'. In fact, insolation during the months June and July is higher in the Arctic than anywhere else on Earth, as discussed at this earlier post.

Feedbacks further accelerate warming in the Arctic, as described in the earlier post Feedbacks in the Arctic. Temperature rises of the water close to the seafloor of the Arctic Ocean is very dangerous, as heat penetrating sediments there could cause hydrate destabilization, resulting in huge amounts of methane entering the atmosphere over the Arctic Ocean.


Minggu, 25 Mei 2014

Large Falls in Arctic Sea Ice Thickness over May 2014

Comparing ice thickness (in meters) on May 2, 2014 (left) and May 30, 2014 (right, forecast run May 25, 2014)
Arctic sea ice has shown large falls in thickness in many areas over the course of May 2014, as shown on above image. The animation below also compares the situation between May 2, 2014, and May 30, 2014 (as forecast by Naval Research Laboratory on May 23, 2014). Ice thickness is in meters.


Thickness is an important indicator of the vulnerability of the ice. If only looking at sea ice extent, one might (wrongly) conclude that sea ice retreat was only minor and that everything looked fine. By contrast, when looking at thickness, it becomes evident that large falls have occurred over the course of May 2014.

Falls at the edges of the sea ice can be expected at this time of the year, but the large fall closer to the center is frightening. On the one hand, it appears to reflect cyclonic weather and subsequent drift of the ice. On the other hand, it also indicates how vulnerable the sea ice has become. Last year, a large area showed up at the center of the sea ice where the ice became very thin, as discussed in July 2013 in the post Open Water at North Pole and again in the September 2013 post North Hole.

The appearance of huge weak areas at the center of the sea ice adds to its vulnerability and increases the prospect of total sea ice collapse, in case of one or more large cyclones hitting the Arctic Ocean later this year. To highlight the dangerous situation, the main image from a post earlier this month is again added below.


Adding to the concerns are huge sea surface temperature anomalies, as illustrated by the image below, showing anomalies at May 23, 2014, and created by Harold Hensel with ClimateReanalyzer and Google Earth.

[ click on image to enlarge ]
The image below shows sea surface anomalies on May 26, 2014, with an overlay of land temperatures, as created by Harold Hensel and edited by Sam Carana.


The image shows sea surface temperatures on the Northern Hemisphere that are 1.44 degrees Celsius warmer than the baselline temperature, despite large areas with cold water partly resulting from the huge amounts of meltwater flowing down along the edges of Greenland into the North Atlantic Ocean. The graph below shows Northern Hemisphere and Global sea surface temperature anomalies over May 2014.

By comparison, current (May 27, 2014) surface temperature anomalies of 0.64°C globally and 0.84°C for the NH. The image below shows annual temperature anomalies (land and ocean data).


Meanwhile, the development of this year's 'north hole' at the center of the sea ice appears to persist, as illustrated by the image below.


Jumat, 09 Mei 2014

Outlook for sea ice remains bleak


In April 2014, Arctic sea ice reached its annual maximum volume. It was the second lowest on record, according to calculations by the Pan-Arctic Ice Ocean Modeling and Assimilation System (PIOMAS) at the Polar Science Center. The ice volume in March 2014 also was the second lowest on record, as discussed in an earlier post. The fall in volume over the years is illustrated in the graph below, by Wipneus.
Another way of depicting the continuing fall in sea ice volume is the Arctic Death Spiral below, by Andy Lee Robinson.

The graph below, from the Danish Metereological Institute, shows mean temperatures that have been much higher than they used to be at higher latitudes. Mean 2 m temperatures for the region north of the 80th northern parallel as a function of the day of year are shown (red line), against the 1958 - 2002 mean (green line).


High levels of methane over the Arctic will have contributed to these high temperatures. Furthermore, the Jet Stream is changing as the difference in temperature between the Arctic and the equator decreases, causing more extreme weather events such as heatwaves and storms that could speed up the demise of snow and ice cover in the Arctic.

The graph below, by the Japan Aerospace Exploration Agency, shows that Arctic sea ice extent was 12,469,546 km² on May 8, 2014.

In addition, an El Niño event could cause even more ferocious heatwaves and storms to hit the Arctic. The image below, from IRI at Columbia University, shows that the chance of an El Niño event developing in the course of 2014 is close to 80%.


The outlook for the sea ice remains bleak and the possibility that a total collapse could occur in September calls for comprehensive and effective action, as discussed at the climate plan blog.