Tampilkan postingan dengan label wildfire. Tampilkan semua postingan

Rabu, 10 Juli 2013

Wildfires even more damaging

Wildfires cause even more damage than many climate models assume. Much has been written about the threat that wildfires pose to people's safety and health, to crop yields, and the quality of soils and forests.

In addition, wildfires pose a huge threat in terms of climate change, not only due to the impact of emissions on the atmosphere, but there's also the impact of particles (soot, dust and volatile organic compounds) settling down on snow and ice, speeding up their demise through albedo changes. This contributes to the rapid decline of the sea ice and snow cover in the Arctic, a decline that has been hugely underestimated in many climate models.

Furthermore, global warming and accelerated warming in the Arctic cause extreme weather conditions in many places, an impact that is again underestimated in many climate models.

A team of scientists from Los Alamos and Michigan Technological University, led by Swarup China, points out that continued global warming will make conditions for wildfires worse, as was already noted in earlier studies, such as this 2006 study. They also point at the conclusion of a recent study that more biomass burning will lead to more ozone, less OH, and a nonlinear increase of methane's lifetime.

Mixing and classification of soot particles. Field-emission
scanning electron microscope images of four different
categories of soot particles: (a) embedded, (b) partly coated,
(c) bare and (d) with inclusions. Approximately 50% of the
ambient soot particles are embedded, 34% are partly coated
and 12% have inclusions. Only 4% of the particles are bare
soot (not coated or very thinly coated). Scale bars, 500 nm.
Right, spherical tar balls dominate in the emissions.
The scientists recently completed an analysis of particles from the Las Conchas fire that started June 26, 2011, and was the largest fire in New Mexico's history at the time, burning 245 square miles. One of the scientists, Manvendra Dubey, said

 “Most climate assessment models treat fire emissions as a mixture of pure soot and organic carbon aerosols that offset the respective warming and cooling effects of one another on climate. However Las Conchas results show that tar balls exceed soot by a factor of 10 and the soot gets coated by organics in fire emissions, each resulting in more of a warming effect than is currently assumed.”
“Tar balls can absorb sunlight at shorter blue and ultraviolet wavelengths (also called brown carbon due to the color) and can cause substantial warming,” he said. “Furthermore, organic coatings on soot act like lenses that focus sunlight, amplifying the absorption and warming by soot by a factor of 2 or more. This has a huge impact on how they should be treated in computer models.”

Finally, many climate models ignore the threat of large, abrupt methane releases in the Arctic. As discussed in many earlier posts at Arctic-news blog, accelerated warming in the Arctic threatens to spiral out of control as methane levels rise over the Arctic, causing destabilization of methane hydrates and further methane releases, escalating into runaway global warming. 

Sabtu, 06 Juli 2013

Wildfires in Canada affect the Arctic

created by Sam Carana with screenshot from wunderground.com
Wildfires can cause a lot of emissions. Obviously, when wood burns, carbon dioxide is emitted into the atmosphere. Wildfires also cause further emissions, such as methane, soot and carbon monoxide. A large part of such emissions can be broken relatively quickly down by hydroxyl, but when large emissions take place, this can take a while. In other words, the lifetime of gases such as methane is extended, particularly in the Arctic where hydroxyl levels are already very low to start with.

Furthermore, the soot that is emitted by such wildfires can settle down on snow and ice, changing its albedo and thus contributing to the demise of the snow and ice cover. As the image shows, soot can be blown high up into the Arctic, depending on the direction of the wind.

Wildfires in Canada and Alaska have now been raging for quite some time. The above image dates back to late last month. Today's images can be quite similar, as illustrated by the two images below.

created by Sam Carana with screenshot from wunderground.com
Smoke from wildfires can travel over quite long distances, as also evidenced by these NASA satellite images showing wildfire smoke crossing the Atlantic Ocean. The relation between wildfire smoke and methane concentrations is further illustrated by the image below.

methane levels July 5, 2013, over 1950 ppb in yellow in 6 layers from 718-840 mb
created by Sam Carana with methanetracker.org - sea ice data by SSMIS
Below, a similar image showing methane on the afternoon of July 6, 2013.

methane levels July 6, 2013, over 1950 ppb in yellow, 7 layers from 469-586 mb
created by Sam Carana with methanetracker.org - sea ice data by SSMIS
Below, a screenshot created with methanetracker, showing some methane still persisting on July 8, 2013.  On the right, the methane originating from the Quebec wildfires appears to have moved farther over the Atlantic Ocean, due to the Coriolis effect. The image also shows some worryingly high methane concentrations in spots above the Arctic sea ice. The spots north of Alaska were also examined in the video at Cruising for methane.

methane levels on the morning of July 8, 2013, over 1950 ppb in yellow, 10 layers from 545 to 742 mb
created by Sam Carana with methanetracker.org
Below, a NASA satellite picture showing wildfires in Manitoba, Canada, captured by Terra satellite on June 29, 2013.

NASA image courtesy Jeff Schmaltz, MODIS Rapid Response Team
In conclusion, while carbon pollution gets a lot of attention, the Arctic is also strongly affected by other emissions that can result from wildfires.

Kamis, 27 Juni 2013

The Threat of Wildfires in the North

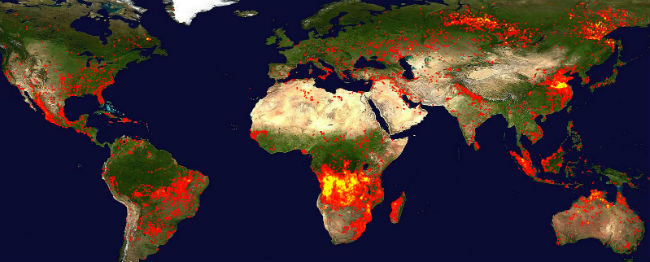
NASA/NOAA image based on Suomi NPP satellite data from April 2012 to April 2013, with grid added
A new map has been issued by NOAA/NASA. The map shows that most vegetation grows in two bands, i.e. the Tropical Band (between latitudes 15°N and 15°S) and the Northern Band in between 45°N and 75°N, i.e. in North America, Europe and Siberia. On above image, the map is roughly overlayed with a grid to indicate latitude and longitude co-ordinates.


Vegetation in the Northern Band extends beyond the Arctic Circle (latitude 66° 33′ 44″ or 66.5622°, in blue on above image from Arcticsystem.no) into the Arctic, covering sparsely-populated areas such in Siberia, Alaska and the northern parts of Canada and Scandinavia. Further into the Arctic, there are huge areas with bush and shrubland that have taken thousands of years to develop, and once burnt, it can take a long time for vegetation to return, due to the short growing season and harsh conditions in the Arctic.


Above map with soil carbon content further shows that the top 100 cm of soil in the northern circumpolar region furthermore contains huge amounts of carbon.

May 16 2013 Drought 90 days Arctic
Global warming increases the risk of wildfires. This is especially applicable to the Arctic, where temperatures have been rising faster than anywhere else on Earth. Anomalies can be very high in specific cases, as illustrated by the temperature map below. High temperatures and drought combine to increase the threat of wildfires (see above image showing drought severity).

June 25, 2013 from Wunderground.com - Moscow broke its more than 100-year-old record for the hottest June 27
Zyryanka, Siberia, recently recorded a high of 37.4°C (99.3°F), against normal high temperatures of 20°C to 21°C for this time of year. Heat wave conditions were also recorded in Alaska recently, with temperatures as high as 96°F (36°C).

On June 19, 2013, NASA captured this image of smoke from wildfires burning in western Alaska. The smoke was moving west over Norton Sound. (The center of the image is roughly 163° West and 62° North.) Red outlines indicate hot spots with unusually warm surface temperatures associated with fire. NASA image by Jeff Schmaltz, LANCE/EOSDIS Rapid Response. Caption by Adam Voiland. - also see this post with NASA satellite image of Alaska.
Siberian wildfires June 21, from RobertScribbler 
from methanetracker.org

Wildfires raged in Russia in 2010. Flames ravaged 1.25 million hectares (4,826 mi²) of land including 2,092 hectares of peat moor.

Damage from the fires is estimated to be $15 billion, in a report in the Guardian.

Cost of fire-fighting efforts and agricultural losses alone are estimated at over $2bn, reports Munich Re, adding that Moscow's inhabitants suffered under a dense cloud of smoke which enveloped the city. In addition to toxic gases, it also contained considerable amounts of particulate matter. Mortality increased significantly: the number of deaths in July and August was 56,000 higher than in the same months in 2009. 


[From: Abrupt Local Warming, May 16, 2012]

Wildfires in the North threaten to cause large emissions of greenhouse gases and soot, which can settle on snow and ice in the Arctic and the Himalayan Plateau, with the resulting albedo changes causing a lot more sunlight to be absorbed, instead of reflected as was the case earlier. This in turn adds to the problem. Additionally, rising temperatures in the Arctic threaten to cause release of huge amounts of methane from sediments below the Arctic Ocean. This situation threatens to escalate into runway global warming in a matter of years, as illustrated by the image below.

How much will temperatures rise?
In conclusion, the risk is unacceptable and calls for a comprehensive and effective action plan that executes multiple lines of action in parallel, such as the 3-part Climate Action Plan below. Part 1 calls for a sustainable economy, i.e. dramatic reductions of pollutants on land, in oceans and in the atmosphere. Part 2 calls for heat management. Part 3 calls for methane management and further measures.


The Climate Action Plan set out in above diagram can be initiated immediately in any country, without the need for an international agreement to be reached first. This can avoid delays associated with complicated negotiations and on-going verification of implementation and progress in other nations.

In nations with both federal and state governments, such as the United States of America, the Climate Action Plan could be implemented as follows:
  • The President directs federal departments and agencies to reduce their emissions for each type of pollutant annually by a set percentage, say, CO2 and CH4 by 10%, and HFCs, N2O and soot by higher percentages.
  • The President demands states to each make the same cuts. 
  • The President directs the federal Environmental Protection Agency (EPA) to monitor implementation of states and to act step in where a state looks set to fail to miss one or more targets, by imposing (federal) fees on applicable polluting products sold in the respective state, with revenues used for federal benefits.
Such federal benefits could include building interstate High-Speed Rail tracks, adaptation and conservation measures, management of national parks, R&D into batteries, ways to vegetate deserts and other land use measurements, all at the discretion of the EPA. The fees can be roughly calculated as the average of fees that other states impose in successful efforts to meet their targets.

This way, the decision how to reduce targets is largely delegated to state level, while states can similarly delegate decisions to local communities. While feebates, preferably implemented locally, are recommended as the most effective way to reach targets, each state and even each local community can largely decide how to implement things, provided that each of the targets are reached.

Similar targets could be adopted elsewhere in the world, and each nation could similarly delegate responsibilities to local communities. Additionally, it makes sense to agree internationally to impose extra fees on international commercial aviation, with revenues used to develop ways to cool the Arctic.

- Climate Plan

Kamis, 10 Januari 2013

Dark Snow Project - Research into soot on Greenland

Fossil fuel combustion creates carbon emissions that increase atmospheric thickness, warming climate. The occurrence of wildfire increases with climate warming, increasing soot loading of the atmosphere. Some of this soot is transported through the atmosphere and is deposited on glaciers, lowering their reflectivity, increasing solar energy absorption, increasing melt rates.
image from DarkSnowProject.org

In parts of Greenland where winter snow loss during each melt season exposes impurity-rich bare ice, the surface reflectivity drops from 85% to 30%. Consequently, most of the 24-hour sunlight goes into ice melt. In this Dark Zone, the impact of soot manifests strongest in a self-reinforcing feedback loop that research by Jason Box has shown to have doubled melt rates in the past decade.

High on the inland ice sheet where melting is rare, satellite data show surface darkening making the researchers suspect that wildfire and industrial soot are to blame. Darkening here promotes snowpack heating, bringing earlier melt, keeping melt going longer. Here is where this feedback is changing the ice sheet in surprising ways, leading to complete surface melting in year 2012.


To measure the extent to which soot particles enhance melting, Jason Box is organizing a Greenland ice sheet expedition for 2013. The Dark Snow Project expedition is to be the first of its kind, made possible by crowd-source funding.


References

Fire and Ice: Wildfires Darkening Greenland Snowpack, Increasing Melting (News Release from Byrd Polar Center)
http://bprc.osu.edu/~jbox/DS/20121205_news_release_CALIPSO_etc.pdf

- The DarkSnowProject
http://darksnowproject.org

-Video: Sampling Greenland, the Dark Snow Project, by Peter Sinclair, produced at Greenman Studio, Midland, MI.
http://www.youtube.com/watch?v=vT6H7HPWkqU

- Where there’s fire there’s smoke - Blog by Jason Box, the Meltfactor.org


Further reading

- Greenland is melting at incredible rate
http://arctic-news.blogspot.com/2012/07/greenland-is-melting-at-incredible-rate.html

Sabtu, 30 Juni 2012

Earth on Fire


Two people have died in the wildfire in Colorado Springs, 347 homes have been destroyed and more than 35,000 people have been forced to evacuate their homes, in the most destructive wildfire in Colorado history, reports Reuters. The destruction surpassed the 257 homes destroyed recently by a large blaze north of Denver.
According the Wikipedia, the 2012 Colorado wildfires have now claimed 5 fatalities, over 600 homes have been destroyed and at least 202,425 acres have burned (i.e. 316.3 square miles or 819.2 square kilometers).
Below, a photo of the smoke cloud at Colorado Springs from the local Waldo Canyon fire, taken on June 26, 2012, by U.S. Air Force/Mike Kaplan.


An AP news update at USAtoday includes:
• Idaho: A fast-moving 1,000-acre wildfire in eastern Idaho that destroyed 66 homes and 29 outbuildings was expected to be contained Saturday. Some 1,000 residents were evacuated.
• Utah: More than 50 houses were destroyed.
• Montana: Authorities in eastern Montana ordered the evacuation of several communities Saturday as the Ash Creek Complex fires, which has burned more than 70 homes this week, consumed another 72 square miles. The blaze grew to 244 square miles overnight.
• Wyoming: A wind-driven wildfire in a sparsely populated area of southeastern Wyoming exploded from eight square miles to nearly 58 square miles in a single day, and an unknown number of structures have burned. About 200 structures were considered threatened.
NASA has released a map, an edited version of which is below, showing the intensity and scope of the heat wave in the western United States, with temperature anomalies reaching 12 degrees Celsius in the period of June 17 to 24, 2012. Colorado experienced the brunt of the heat wave and had eight large wildfires burning on June 28, 2012. Wyoming and Utah—other states that have seen unusually hot weather—together had nine wildfires burning.

NASA adds that this heat wave, like all extreme weather events, has its direct cause in a complex set of atmospheric conditions that produce short-term weather. However, weather occurs within the broader context of the climate, and there’s a high level of agreement among scientists that global warming has made it more likely that heat waves of this magnitude will occur.
The image on the right, edited from another NASA image, depicts the relative concentration of aerosols in the skies above the continental United States on June 26, 2012.
As the image below shows, the heat wave is moving east, with temperatures reaching extremely high values over much of the United States. The image, edited from weather.gov, shows temperature predictions in both Celsius and Fahrenheit.

The image below, edited from NOAA, shows that temperatures are predicted to reach peaks on the East Coast of over 115 degrees Fahrenheit on Sunday, July 1st, 2012.

The United States isn't the only place witnessing extreme temperatures. Fires are raging in Russia, while I recently described the danger of abrupt local warming in the Arctic.
The NASA Global Fire Map below shows fires detected by satellite from June 9 to June 18, 2012.

The image below, from the Climate Emergency Institute, shows that most of the largest climate feedbacks take place at higher latitudes on the Northern Hemisphere. 


Jumat, 22 Juni 2012

Fires are raging again across Russia

NASA satellite image, acquired April 24, 2012 
Back in April, thousands of hectares were burning when NASA captured above image of fires in a rural area north of Omsk, a city in south central Russia near the Kazakhstan border, according to the NASA report accompanying the image.

In May 6, 2012, the Voice of Russia reported some 11000 hectares (about 42.4 square miles) of forests in Siberia to be on fire.

Lena River, Siberia - Wikipedia
Earlier this month, eight Russian paratroopers died fighting a massive forest fire in southern Siberia, reports UPI.

Russia has now declared a state of emergency in several eastern regions, due to hundreds of wildfires, reports NASA.

Smoke from fires burning in Siberia can travel across the Pacific Ocean and into North America. A NASA analysis of satellite images shows that aerosols from fires took six days to reach America's shores. In certain cases they saw smoke that actually circles the globe, describes NASA.

These fires are causing a lot of emissions, including soot that can be deposited on the ice in the Arctic, resulting in more sunlight to be absorbed which will speed up the melt.

Furthermore, high temperatures in Siberia will warm up the water in rivers, causing warm water to flow into the Arctic, as illustrated by above Wikipedia image highlighting the Lena River and the August 3, 2010, satellite image below, showing warm river water heat up the Laptev Sea (degrees Celsius).


The image below was edited from a report by NOAA’s National Climatic Data Center, describing that the globally-averaged temperature for May 2012 marked the second warmest May since record keeping began in 1880.

NOAA image, temperature anomalies for May 2012
The image below was edited from a recent NASA report describing a total of 198 fires burning across Russia. As the inset shows, the fires on the main image are part of an area where further fires are raging.

NASA satellite image, acquired June 18, 2012
Below are two maps from the NOAA Climate Prediction Center, showing temperature anomalies in Southern Russia for the week from June 10th to 16th, 2012, of over 7 degrees Celsius (12.6 degrees Fahrenheit), with temperatures in areas around the Caspian Sea reaching over 40 degrees Celsius (104 degrees Fahrenheit).

Perhaps even more worrying than high temperatures in Southern Russia are high temperature anomalies in Northern Siberia, some of which were in the 16-18 degrees Celsius range for the week from June 10-16th, 2012 (see NOAA image below).
Satellite image June 15, 2012 from DMI - http://ocean.dmi.dk/arctic/satellite/index.uk.php

Source: mapsofworld.com via Sam on Pinterest